VISILAB, E.T.S.I.I, University of Castilla-La Mancha, Ciudad Real, Spain
Authors:M. Milagro Fernandez-Carrobles, Ismael Serrano, Oscar Deniz, Gloria Bueno
Abstract:The methodology carried out for this challenge was based on texture features to describe breast tissue. Firstly, the thumbnail slide image is used to select a ROI focused on extracting only the area of the image where the tissue is located. This area is later divided into several regions of 400x400 pixels where the 1st and 2nd Haralick statistical coefficients are calculated (241 features). Training and test processes were carried out using 10-fold cv with the Bagging classifier. A comparative analysis was done using Deep Learning classification. The 400x400 subsamples were used to train a Convolution Neuronal Network (CNN). The CNN methodology gave good results for the training but not for the testing. To evaluate whether each entire WSI has cancer 12 different measures are obtained for each of the previous region descriptor. To tackle the slide-based evaluation, a SVM classifier with polynomial kernel is trained. Those slides that have been classified as cancer are saved on the first slide-based evaluation with its score classification. For lesion-based evaluation, two approaches are proposed. The 1st method uses the convex area descriptor and a threshold to discriminate whether the region is tumour or not. The 2nd method uses all region descriptors together using morphometric, geometric and textural features to classify into false or true detections. In the slide-based classification an AUC equal to 0.9952 was obtained, with 98.13% of TP and 1.28% of FP. The FROC is calculated for each method. The metastases detection sensitivity is 0.398 and 0.366 for method 1 and 2, respectively. The false positive average achieves a value of 12.28 for method 1 and decrease to 10.71 with method 2.
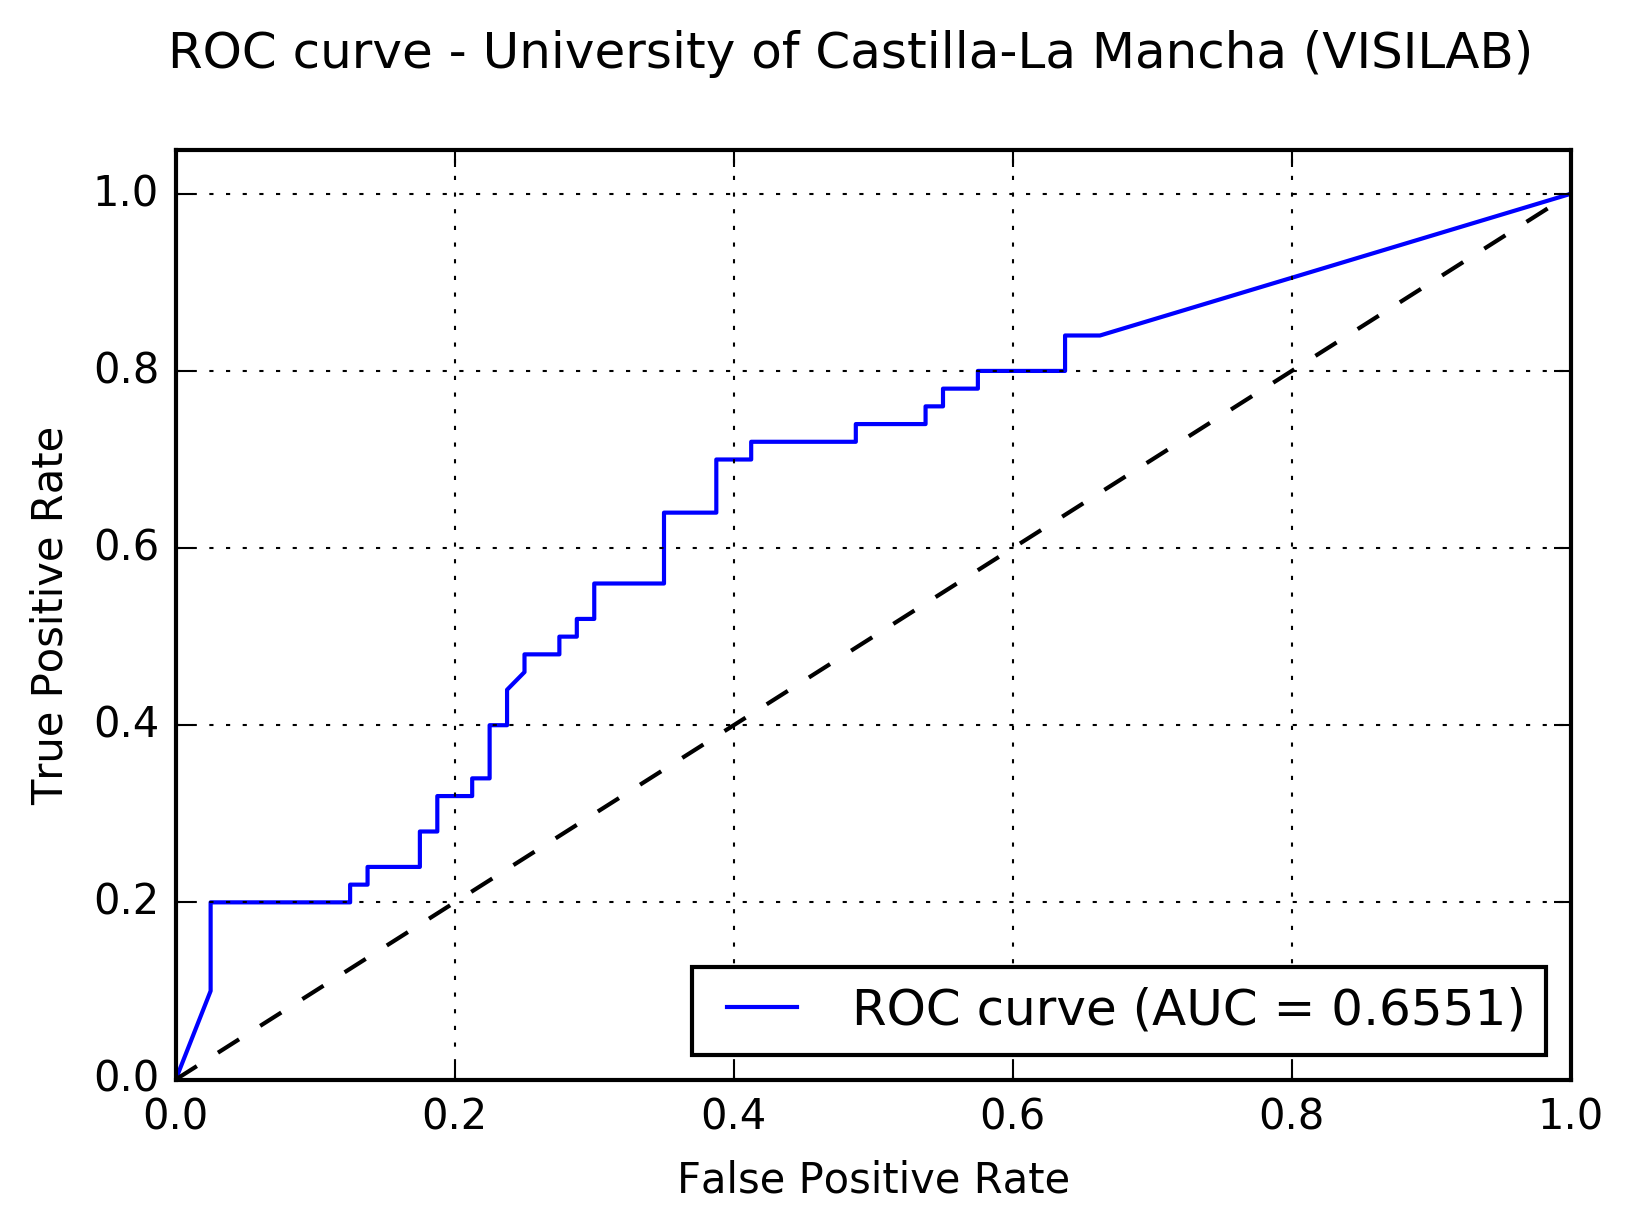
Results:The following figure shows the receiver operating characteristic (ROC) curve of the method.

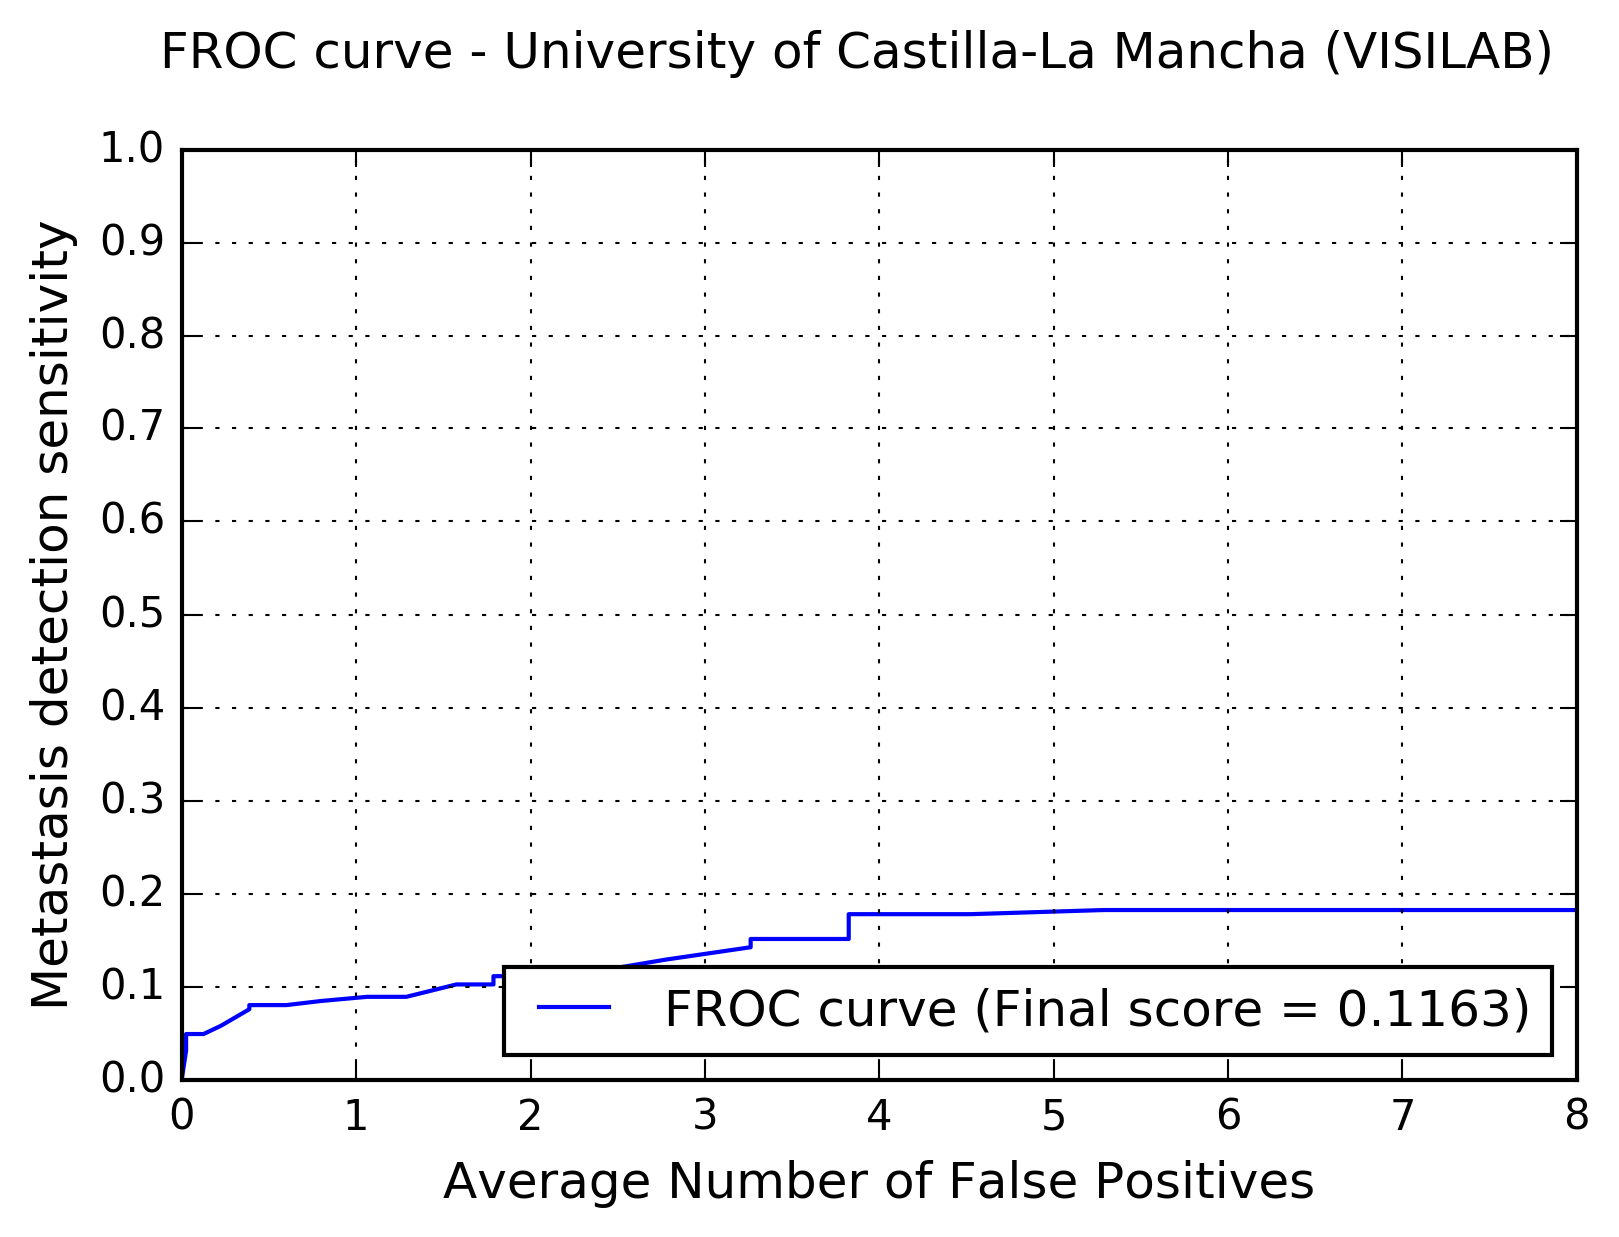
The following figure shows the free-response receiver operating characteristic (FROC) curve of the method.

The table below presents the average sensitivity of the developed system at 6 predefined false positive rates: 1/4, 1/2, 1, 2, 4, and 8 FPs per whole slide image.
| FPs/WSI | 1/4 | 1/2 | 1 | 2 | 4 | 8 |
| Sensitivity | 0.058 | 0.080 | 0.089 | 0.111 | 0.178 | 0.182 |
